|
1 2 3 4 5 6 7 8 9 10 11 12 13 14 15 16 17 18 19 20 21 22 23 24 25 26 27 28 29 30 31 32 33 34 35 36 37 38 39 40 41 42 43 44 45 46 47 48 49 50 51 52 53 54 55 56 57 58 59 60 61 62 63 64 65 66 67 68 69 70 71 72 73 74 75 76 77 78 79 80 81 82 83 84 85 86 87 88 89 90 91 92 93 94 95 96 97 98 99 100 101 102 103 104 105 106 |
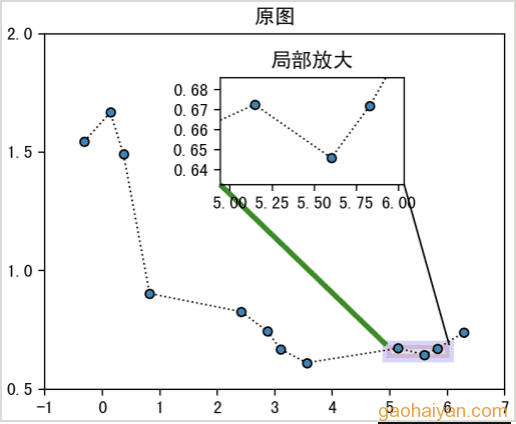
import matplotlib.pyplot as plt from matplotlib.pyplot import MultipleLocator from mpl_toolkits.axes_grid1.inset_locator import inset_axes from matplotlib.transforms import TransformedBbox from mpl_toolkits.axes_grid1.inset_locator import BboxPatch, BboxConnector # 原数据,共12个标记(点) x = [-0.31415927, 0.14083002, 0.36832466, 0.82331394, 2.41577642, 2.8707657, 3.09826034, 3.55324962, # 5.14571211, 5.60070139, 5.82819603, 6.28318531] y = [1.5453777, 1.66769369, 1.49131539, 0.90375183, 0.82717738, 0.74379076, 0.66878662, 0.61166783, # 0.67266149, 0.64598655, 0.67193247, 0.73935584] # 要放大区间,索引为8-10的点 point_first = 8 point_last = 10 # 小图扩展系数 x_ratio = 0.3 # x轴多显示间隔 y_ratio = 0.5 # y轴多显示间隔 # --- 计算小图的坐标刻度区间 --- 【重点1】 # 小图X轴的显示范围 x_diff_left = (x[point_last] - x[point_first]) * x_ratio # 右边的比左边的大,求差值 x_diff_right = (x[point_last] - x[point_first]) * x_ratio # x_lim_left = x[point_first] - x_diff_left # 左边范围往左挪半个刻度 x_lim_right = x[point_last] + x_diff_right # 右边往右挪 # 小图Y轴的显示范围 y_max = max(y[8:11]) y_min = min(y[8:11]) y_diff_left = (y_max - y_min) * y_ratio # 取两个点的差 y_diff_right = (y_max - y_min) * y_ratio # y_lim_left = y_min - y_diff_left # 底部往下挪 y_lim_right = y_max + y_diff_right # 顶部往上挪 # ====== 原图 ====== fig, ax = plt.subplots(1, 1, figsize=(6, 4)) ax.set_title("原图") ax.set_xlim(-1, 7) # 子图窗口大小固定了,调整子坐标系的显示范围 ax.set_ylim(0.5, 2) ax.xaxis.set_major_locator(MultipleLocator(1)) ax.yaxis.set_major_locator(MultipleLocator(0.5)) ax.plot( # x, y, # color='k', # linestyle=':', linewidth=1, # marker='o', markersize=5, markeredgecolor='black', markerfacecolor='C0') # ====== 子图 ====== # 插入子图。绘制局部放大图的坐标系 axins = inset_axes( # ax, # width="40%", height="30%", # 宽高,str百分比或float小数比例 loc=1, # 子图锚点位置: # 'upper right' : 1, 右上角 # 'upper left' : 2, 左上角 # 'lower left' : 3, 左下角 # 'lower right' : 4, 右下角 # 'center left' : 6, 左中 # 'center right' : 7, 右中 # 'lower center' : 8, 底中 # 'upper center' : 9, 顶中 # 'center' : 10 图中心 bbox_to_anchor=(-0.2, -0.1, 1, 1), # 根据锚点设置子图的位置 # loc设置的锚点系,决定了这里的便宜方向 。 # left, 锚点向【右】偏离原位置的距离比例,窗口宽的百分比 0-1 # bottom, 锚点向【上】偏离原位置的距离比例,窗口高的百分比 0-1 # width, [保持1],宽使用参数width的设置 # height, [保持1],高使用参数height的设置 bbox_transform=ax.transAxes) axins.plot( # 子图绘制原始数据 x, y, # color='k', linestyle=':', linewidth=1, # marker='o', markersize=5, markeredgecolor='black', markerfacecolor='C0') axins.set_title("局部放大") # --- 设置小图的坐标刻度区间 --- 【重点1】 axins.set_xlim(x_lim_left, x_lim_right) # 子图窗口大小固定了,调整子坐标系的显示范围 axins.set_ylim(y_lim_left, y_lim_right) axins.xaxis.set_major_locator(MultipleLocator(0.25)) axins.yaxis.set_major_locator(MultipleLocator(0.01)) # ====== 原图的要放大区域 ====== rect = TransformedBbox(axins.viewLim, ax.transData) box = BboxPatch(rect, color="r", alpha=0.2, ec="b", lw=5) ax.add_patch(box) # ====== 2个图的连接线 ====== 【重点2】-BboxConnector line_1 = BboxConnector( # 连线 axins.bbox, # bbox1 rect, # bbox2 loc1=3, # 从bbox1的哪个点连线。右上:1, 左上:2, 左下:3, 右下:4 loc2=2, # 从bbox2的哪个点连线。 color='g', lw=3 ) line_1.set_clip_on(False) # 关闭图形重叠时的布尔运算。否则线条会不显示 line_2 = BboxConnector(axins.bbox, rect, loc1=4, loc2=1) line_2.set_clip_on(False) axins.add_patch(line_1) axins.add_patch(line_2) plt.show() |

- end
声明
本文由崔维友 威格灵 cuiweiyou vigiles cuiweiyou 原创,转载请注明出处:http://www.gaohaiyan.com/3013.html
承接App定制、企业web站点、办公系统软件 设计开发,外包项目,毕设


