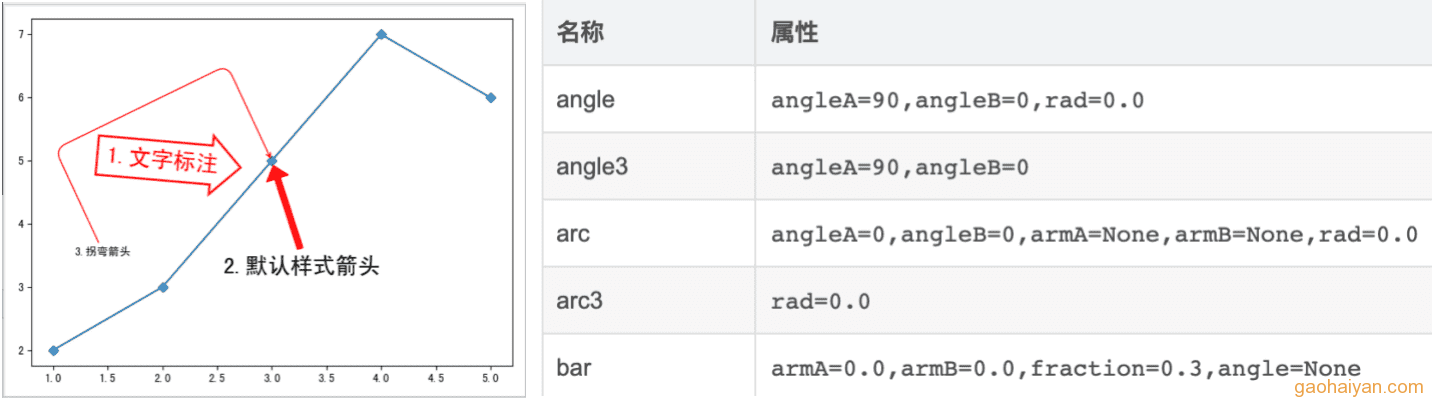
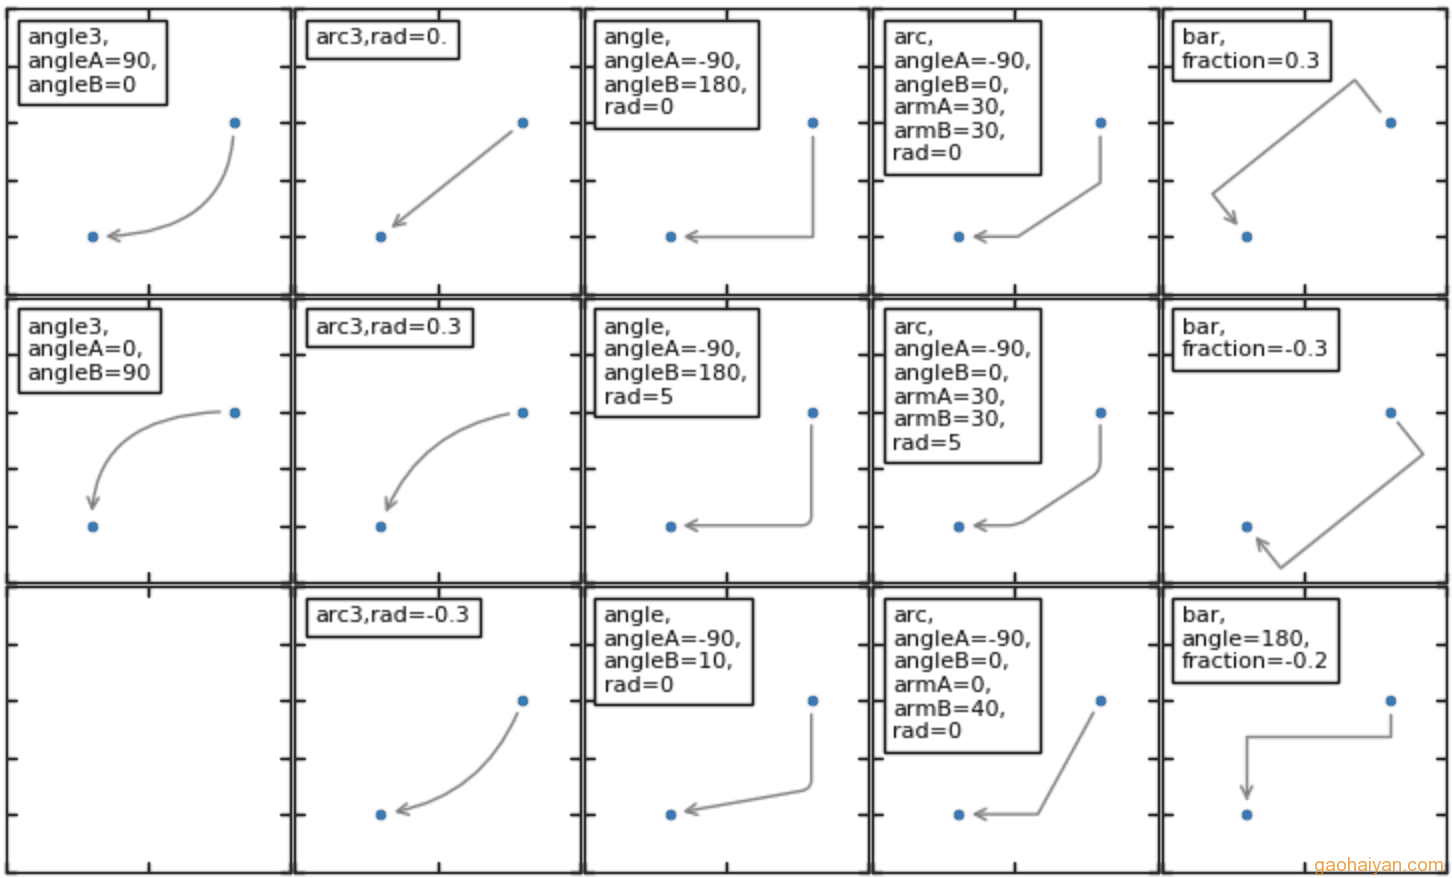
1.标注-1:annotate、边框样式、箭头样式
|
1 2 3 4 5 6 7 8 9 10 11 12 13 14 15 16 17 18 19 20 21 22 23 24 25 26 27 28 29 30 31 32 33 34 35 36 37 38 39 40 41 42 43 44 45 46 47 48 49 50 51 52 53 54 55 56 57 58 59 60 61 62 63 64 65 66 67 68 69 70 71 72 73 74 75 76 77 78 79 80 81 82 83 84 85 86 87 88 89 90 91 92 93 94 95 96 |
import matplotlib.pyplot as plt x1 = [1, 2, 3, 4, 5] y1 = [2, 3, 5, 7, 6] plt.plot(x1, y1, marker='D') # 线条 bbox_props = dict( # boxstyle="rarrow", # 边框样式 import matplotlib.patches as mpatch; mpatch.BoxStyle.get_styles() # circle 圆形 # square 长方形 # round 圆角方框 # round4 凸边圆角方框 # roundtooth 波浪边方框 # sawtooth 锯齿边方框 # rarrow 箭头-左箭头 # darrow 双向箭头 # larrow 左箭头 # rarrow 右箭头 pad=0.4, # padding 内边距,文字和边框的距离。1即距离1个字的高度 fc="w", # facecolor 文字颜色 alpha=0.9, # 文字透明度0-1 ec="r", # edgecolor 边框颜色,如果是0-1数字表示透明度 lw=2) # linewidth 边框粗细 plt.text( # 2, # x 5, # y "1.文字标注", # 文字 color='r', # 文字颜色 ha="center", # horizontalalignment va="center", # verticalalignment size=20, # 文字大小 rotation=-5, # 正常时为水平0。正数为逆时针旋转 bbox=bbox_props) # 包裹体 plt.annotate( # '2.默认样式箭头', # xy=(3, 5), # 尖头的位置。xy即图形的刻度 xytext=(4, 3.5), # 尾部文字的位置 xycoords='data', # 坐标系 textcoords='data', # 坐标系: # 'figure points' 距离图形左下角的点数量 # 'figure pixels' 距离图形左下角的像素数量 # 'figure fraction' 0,0 是图形左下角,1,1 是右上角 # 'axes points' 距离轴域左下角的点数量 # 'axes pixels' 距离轴域左下角的像素数量 # 'axes fraction' 0,0 是轴域左下角,1,1 是右上角 # 'offset points' 没有偏移,xytext参数等于xy参数的值 # 'data' 使用轴域数据坐标系。默认 arrowprops=dict( # fc='r', # 填充色 ec="r", # 边框色 width=5, # 箭柄宽度,以点为单位 headwidth=20, # 箭头宽度 shrink=0.05), # shrink收缩比例0-1,防止压在要指的点上 horizontalalignment='right', # 文字对齐 verticalalignment='top', # 文字对齐 fontsize=20) # 文字大小 plt.annotate(# "3.拐弯箭头",# xy=(3, 5), # xytext=(1.2, 3.5), # xycoords='data',# textcoords='data',# arrowprops=dict(# arrowstyle="->",# 箭头样式: # '-' 只有箭杆 # '->' 线杆右端鱼钩三角箭头 # '<-' 线杆左端鱼钩三角箭头 # '<->' 线杆两端鱼钩三角箭头 # '-[' 线杆端中括号 # ']-' 线杆左端中括号 # '|-|' 线杆两端是竖杠 # '-|>' 线杆右端实心三角箭头 # '<|-' 线杆左端实心三角箭头 # '<|-|>' 线杆两端是实心三角箭头 # 以下3种必须使用angle3或arc3连接 # 'fancy' 鱼尾实心宽体箭头 # 'simple' 普通宽体箭头 # 'wedge' 楔子(椎体)宽体箭头 fc='r', # 填充色 ec="r", # 边框色 # width=5, # 不可和arrowstyle同时配置 # headwidth=20, # 不可和arrowstyle同时配置, # shrink=0.05, # 不可和arrowstyle同时配置, connectionstyle="arc, angleA=115, angleB=115, armA=140, armB=130, rad=15"),# 折弯方式: # arc方式 # angleA 尾巴发出的角度。水平为0,正数逆时针旋转 # angleB 箭头射入后的角度。水平为0,正数逆时针旋转 # armA 尾巴到第一个拐角的距离 # armA 箭头到第2个拐角的距离 # rad 拐角的圆弧大小 ) plt.show() |
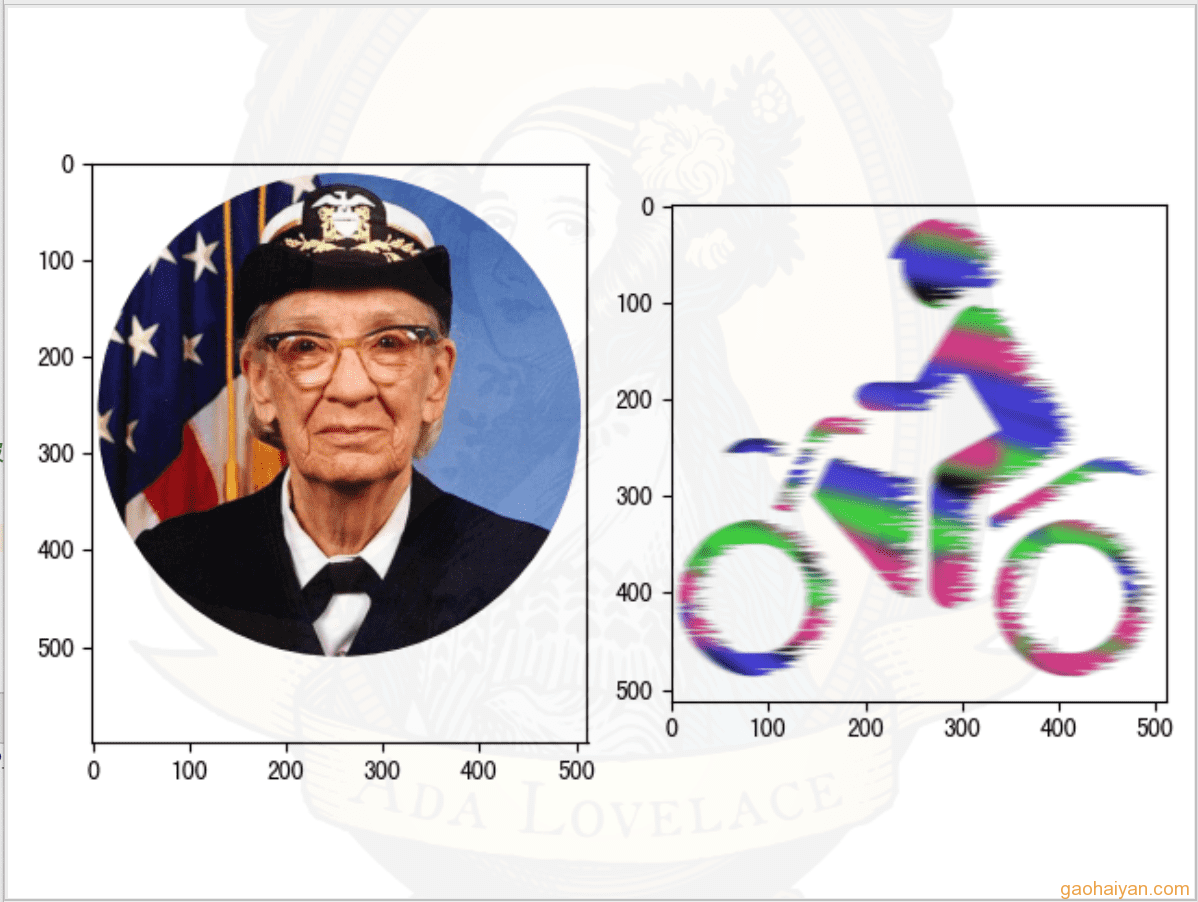
2.显示图片
|
1 2 3 4 5 6 7 8 9 10 11 12 13 14 15 16 17 18 19 20 21 22 23 24 25 26 27 28 29 30 31 32 33 34 35 36 |
import matplotlib.pyplot as plt import matplotlib.patches as patches import matplotlib.cbook as cbook window, blocks = plt.subplots(1, 2) # 1行2列。 picture_1 = blocks[0] picture_2 = blocks[1] # 加载matplot的示例图片【星条旗前的格蕾丝·赫柏】 # /Library/Frameworks/Python.framework/Versions/3.7/lib/python3.7/site-packages/matplotlib/mpl-data/sample_data/ with cbook.get_sample_data('grace_hopper.png') as image_file: image = plt.imread(image_file) patch = patches.Circle( # 圆形遮罩。图片不随遮罩大小变化。 xy=(255, 260), # 遮罩所占矩形区域的宽高。原点在左上角。 radius=250, # 遮罩圆的半径 transform=picture_1.transData) # 圆心设为遮罩矩形中心 im = picture_1.imshow(image) # 绘图片,默认最大化显示 im.set_clip_path(patch) # 绘遮罩 # picture_1.axis('off') # 关闭刻度条 # 加载绝对路径图片文件 image = plt.imread('/Users/test/Desktop/imgs/99999.png') # 获取图像。【骑摩托】 picture_2.imshow(image) # 显示图片 # 给窗体/画布加个背景图片。【计算机科学家阿达】 import matplotlib.image as image with cbook.get_sample_data('ada.png') as file: ada = image.imread(file) window.figimage( # ada, # 图片数据 60, # 左边距 -110, # 下边距 zorder=3, # 正数置于顶层,遮挡先绘制的图片;负数置于底层,被深度浅的遮挡。负数时更像背景 alpha=0.05) # 透明度 plt.show() |
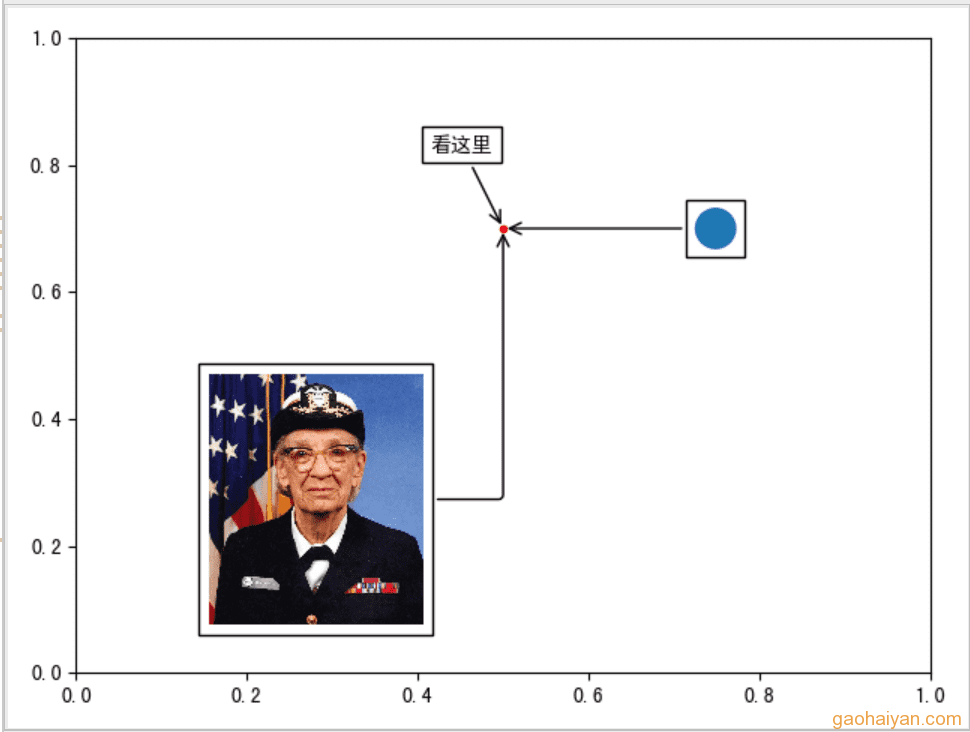
3.标注-2:AnnotationBbox
|
1 2 3 4 5 6 7 8 9 10 11 12 13 14 15 16 17 18 19 20 21 22 23 24 25 26 27 28 29 30 31 32 33 34 35 36 37 38 39 40 41 42 43 44 45 46 47 48 49 50 51 52 53 54 55 56 57 58 59 60 61 62 63 64 |
import matplotlib.pyplot as plt from matplotlib.patches import Circle from matplotlib.offsetbox import (TextArea, DrawingArea, OffsetImage, AnnotationBbox) from matplotlib.cbook import get_sample_data # 一个点 targetPoint = (0.5, 0.7) # 文字标注 offsetbox = TextArea("看这里", minimumdescent=False) # 文字。minimumdescent是否设置最小边距? annotation_1 = AnnotationBbox( # 标注盒子 offsetbox, # 要包裹的文字 targetPoint, # 要指向的点 xycoords='data', # 坐标系,影响 xybox boxcoords="offset points", # 坐标系,影响 xybox xybox=(-20, 40), # 文字中心的位置。坐标受上面2个coords影响, # data和offsetpoints时,坐标位于目标点,此时xybox的x、y对应目标点的十字象限 arrowprops=dict(arrowstyle="->")) # 箭头样式 # 图片标注 png = get_sample_data("grace_hopper.png", asfileobj=False) arr_img = plt.imread(png, format='png') imagebox = OffsetImage(arr_img, zoom=0.2) # imagebox.image.axes = screen annotation_2 = AnnotationBbox( # imagebox, # targetPoint, # xycoords='data', # boxcoords="offset points", # xybox=(-90, -130.), # pad=0.5, # 图片内边距 arrowprops=dict( # arrowstyle="->", # connectionstyle="angle,angleA=0,angleB=90,rad=3")) # 图形标注 circle = Circle( # xy=(10, 10), # 圆心在其area中的位置 radius=10) # 半径 area = DrawingArea( # width=20, # 宽 height=20) # 高 area.add_artist(circle) annotation_3 = AnnotationBbox( # area, # targetPoint, # xycoords='data', # boxcoords=("offset points"), # xybox=(102, 0), # arrowprops=dict(arrowstyle="->")) # 打开一个窗体 fig, screen = plt.subplots() # 绘制目标点 screen.plot(targetPoint[0], targetPoint[1], ".r") # 添加标注 screen.add_artist(annotation_1) screen.add_artist(annotation_2) screen.add_artist(annotation_3) screen.set_xlim(0, 1) screen.set_ylim(0, 1) plt.show() |
- end
声明
本文由崔维友 威格灵 cuiweiyou vigiles cuiweiyou 原创,转载请注明出处:http://www.gaohaiyan.com/2966.html
承接App定制、企业web站点、办公系统软件 设计开发,外包项目,毕设


